The DUT-OMRON Image Dataset
Table of Contents
What's New
We have removed four images (img_561715398.jpg, sun_bqfgwnmzhjwuphdi.jpg, sun_bswlalhygmnrhvuw.jpg, sun_buaqzytduodbufcb.jpg) from dataset due to the lack of corresponding pixel-wise ground-truth. If you have already downloaded our dataset, please delete the four images from your image dataset, eye-fixation and bounding box ground-truth folders, or you can re-download new data from DUT-OMRON Dataset Images,Bounding Box Ground-truth and Eye Fixation Ground-truth. We thank Xianghuan Duan who reported the bug.
Introduction
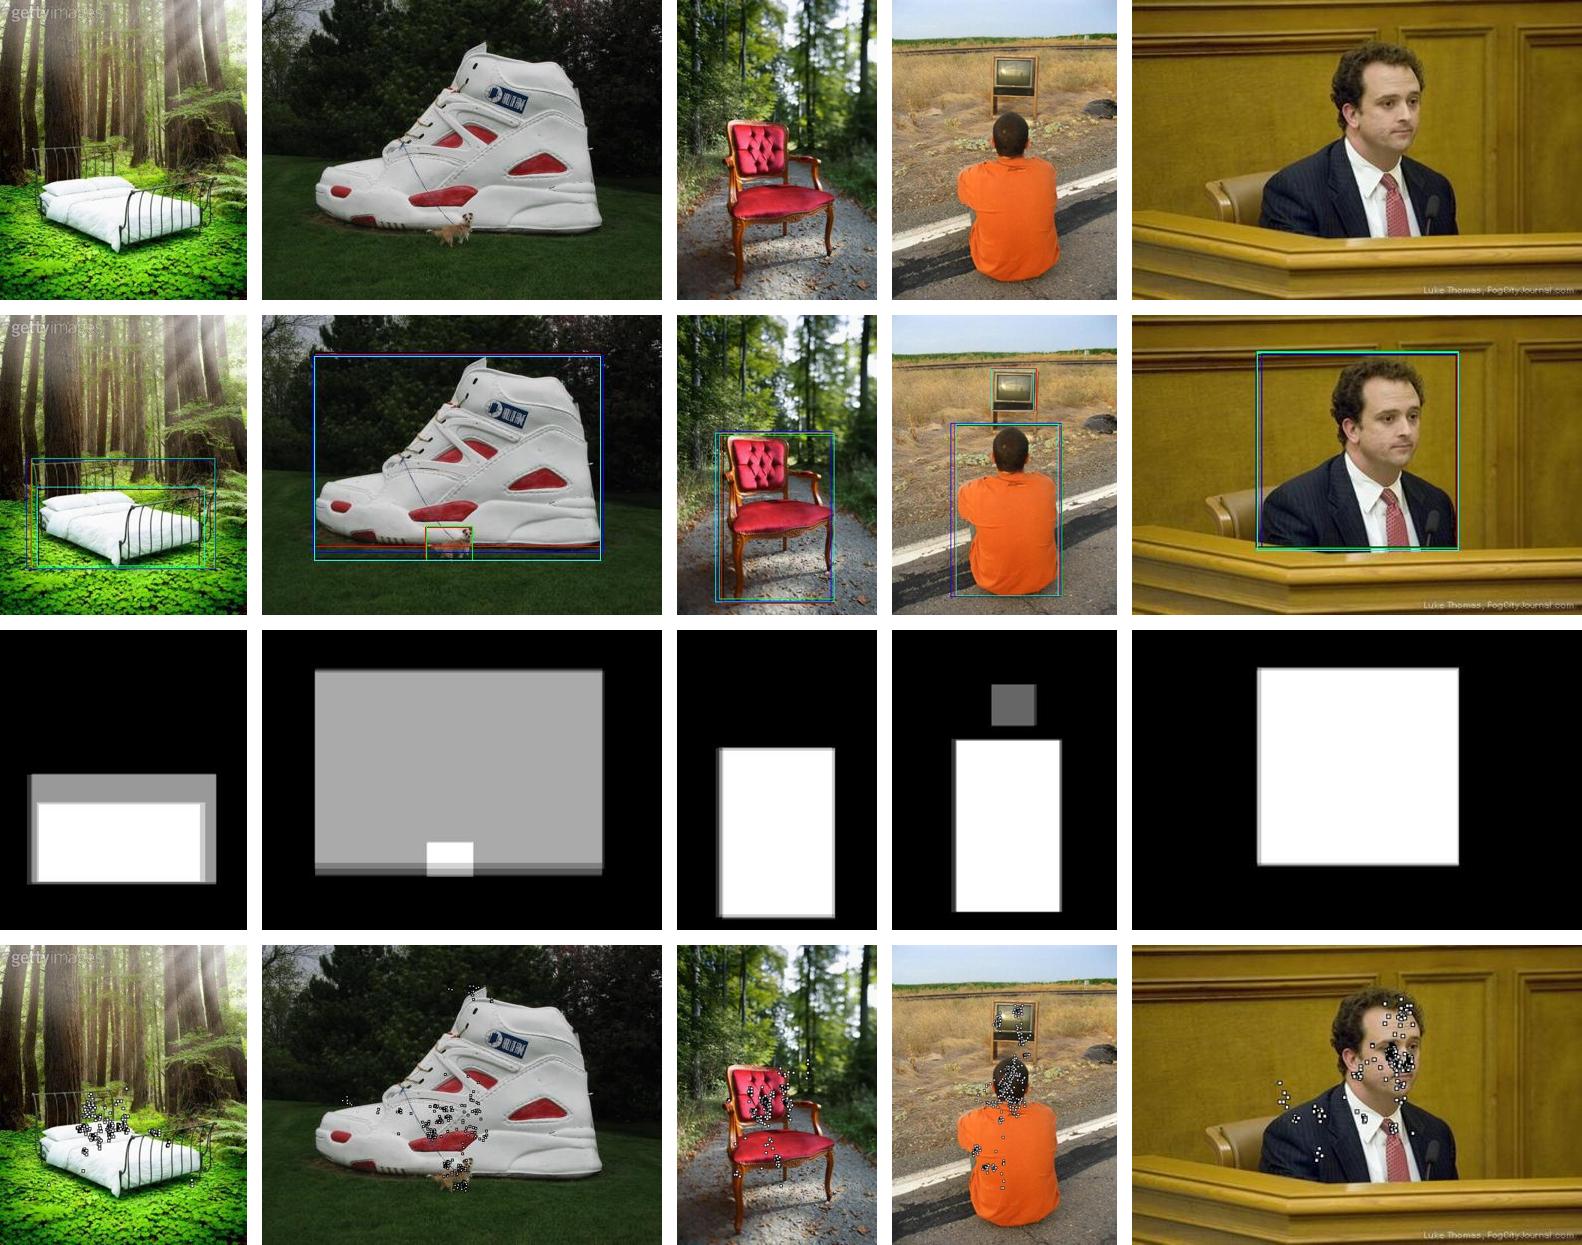
Figure 1: Samples of the dataset. From top to bottom: original image, bounding box ground truth, pixel-wise ground truth, average of the five binary masks and eye-fixation ground truth.
Recent years have witnessed significant improvements in saliency detection methods 1-13 17-19. The experimental results on the existing datasets 8,14 have reached a very high level, hardly to surpass for subsequent research whereas the images in those datasets are much simpler than real nature images. Thus we introduce a new database, DUT-OMRON, with nature images for the research of more applicable and robust methods in both salient object detection and eye fixation prediction.
The proposed database consists of \(5,168\) high quality images manually selected from more than \(140,000\) images. We resize the images to \(400\times x\) or \(x\times 400\) pixels, where \(x\) is less than \(400\). Images of our database have one or more salient objects and relatively complex background. We have \(25\) participants in all for collecting the ground truth, five participants' labels for each image. All of them have normal or corrected to normal vision and are aware of the goal of our experiment. We construct pixel-wise ground truth, bounding box ground truth and eye-fixation ground truth for the proposed database.
Our dataset is the only dataset which has both the eye fixations, bounding box and the pixel-wise ground truth in such large scale. Compared with the ASD and MSRA datasets and some other eye-fixation datasets (i.e., the MIT 15 and NUSEF 16 datasets), images in the proposed dataset are more difficult, thus more challenging, and provide more space of improvement for related research in saliency detection.
Copyright claim of the ground-truth annotation
All rights reserved by the original authors of DUT-OMRON Image Dataset.
Contact information
This website is maintained by Xiang Ruan ( ruanxiang at tiwaki dot com ), if you find bug or have concern about this website, shoot me an email.
For information about the dataset, please contact:
| Name | Affiliation | |
|---|---|---|
| Huchuan Lu | lhchuan at dlut dot edu dot cn | Dalian University of Technology |
| Xiang Ruan | ruanxiang at dlut dot edu dot cn | Dalian University of Technology |
Dataset
Pixel-wise data
We provide pixel-wise ground truth for all the images in the dataset, which are more accurate than bounding box ground truth for evaluation of saliency models. The third row of Figure 1 shows some examples of pixel-wise ground truth.
Experimental results based on pixel-wise ground truth
![]()
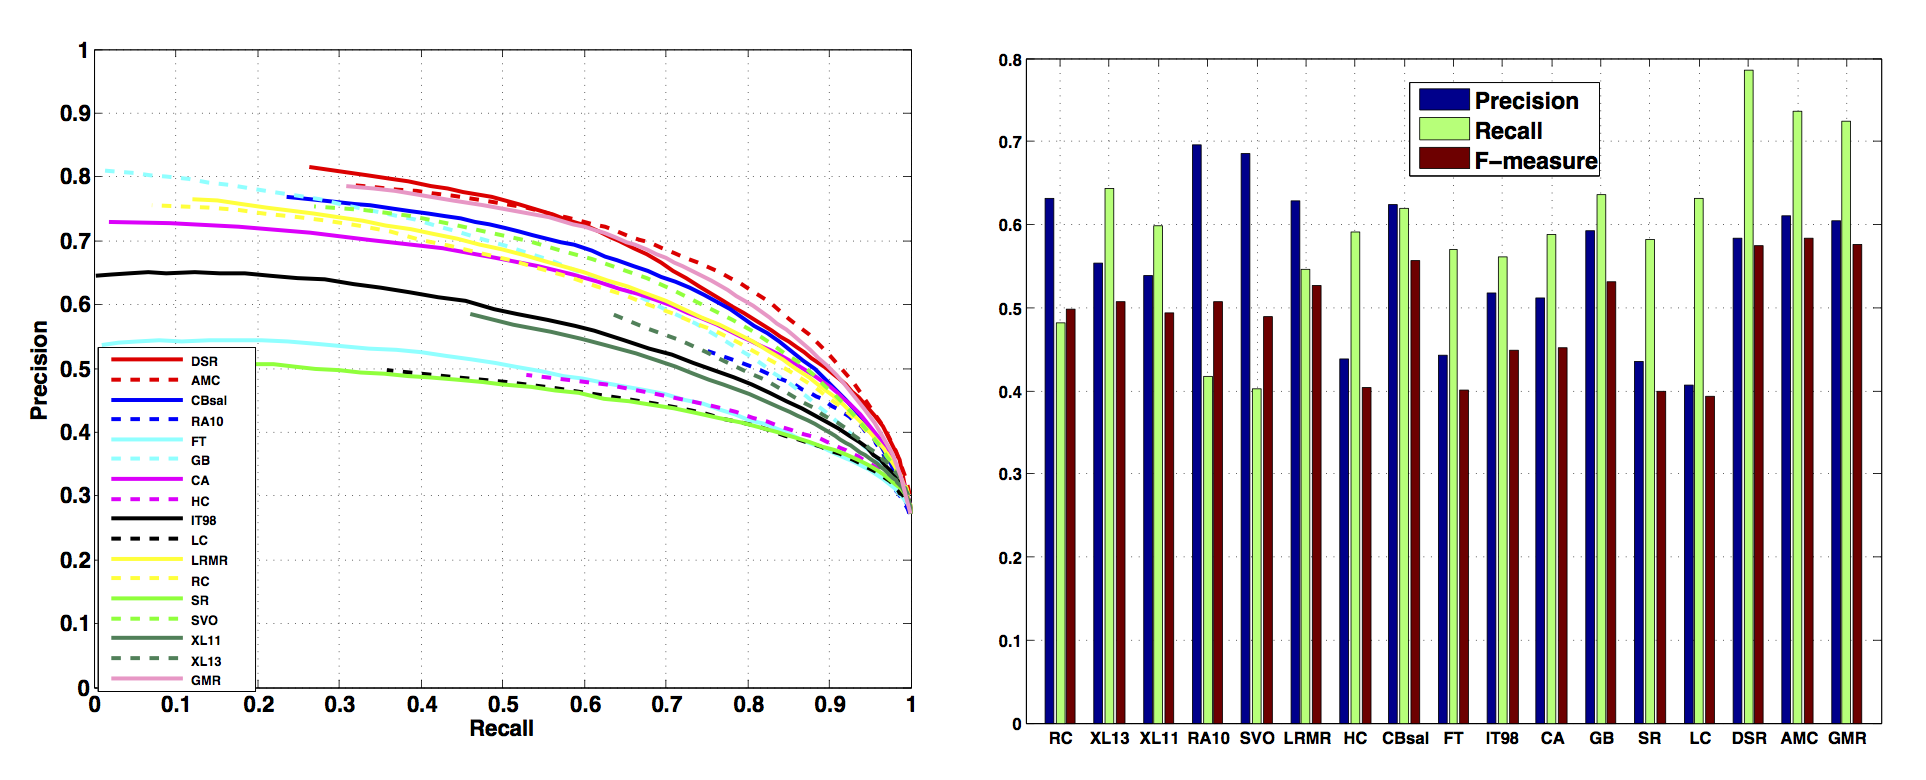
Figure 2: Evaluation results on the DUT-OMRON dataset. 17 methods are evaluated: CBsal 1, XL13 2, XL11 3, RC 4, RA10 5, SVO 6, LRMR 7, FT 8, IT98 9, CA 10, HC 4, GB 11, SR 12, LC 13, AMC 17, DSR 18, GMR 19.
We evaluate 17 methods 1-13, 17-19 on our dataset using the pixel-wise ground truth. Figure 2 shows the P-R curves and F-Measure results of 17 methods.
Bounding box data
For each image, the participants are asked to draw several rectangles which enclose most salient objects in the image while the number of the rectangles is decided by their own understanding of the image. We obtain five participants' annotations and at least five rectangles for each image. In order to get a consistent mask among the five participants, fist we utilize each person's annotations to get a binary mask. Then the final ground truth is generated based on the average of five binary masks. The fourth row of Figure 1 shows some examples of gray-level bounding box ground truth.
Experimental results based on bounding box ground truth
We evaluate 17 methods 1-13,17-19 on our dataset to test both the methods and the dataset using Precision and Recall (P-R) curves and F-Measure as the evaluation criteria. The results are shown in Figure 3. ( please also check saliency maps of the 14 methods and sample of saliency maps ). The evaluation results on our dataset are basically consistent with the results on other datasets, which further indicates the reliability and feasibility of the DUT-OMRON dataset.
Eye-fixation data
We use an eye tracking apparatus, Tobbii X1 Light Eye tracker, to record eye fixations when the participant focuses on the input image shown in the monitor. Each image is displayed for 2 seconds with no intervals between successive images. Five viewers' eye tracking data are recorded for every image of the dataset.
We take the following four steps to exclude the outliers from the original data:
- Firstly, the first fixation of an image from each participant is discarded to avoid the influence of center bias.
- Secondly, by using the human labeled bounding box ground truth, the outliers outside the labeled rectangles are removed, which means any fixations within any viewer's rectangle will be retained. Most of the outliers are removed in this step.
- Thirdly, K-means algorithm is used to classify the points into three clusters since we have more than one object in most of the images.
- Lastly, we retain 90% of the fixations based on Euclidean distance from the cluster center.
After removing outliers, \(153\) reliable eye fixations on average are retained for each image and over \(95\%\) of the images have more than \(50\) eye fixations. Figure 4 shows some examples of the eye-fixation ground truth before versus after removing outliers.
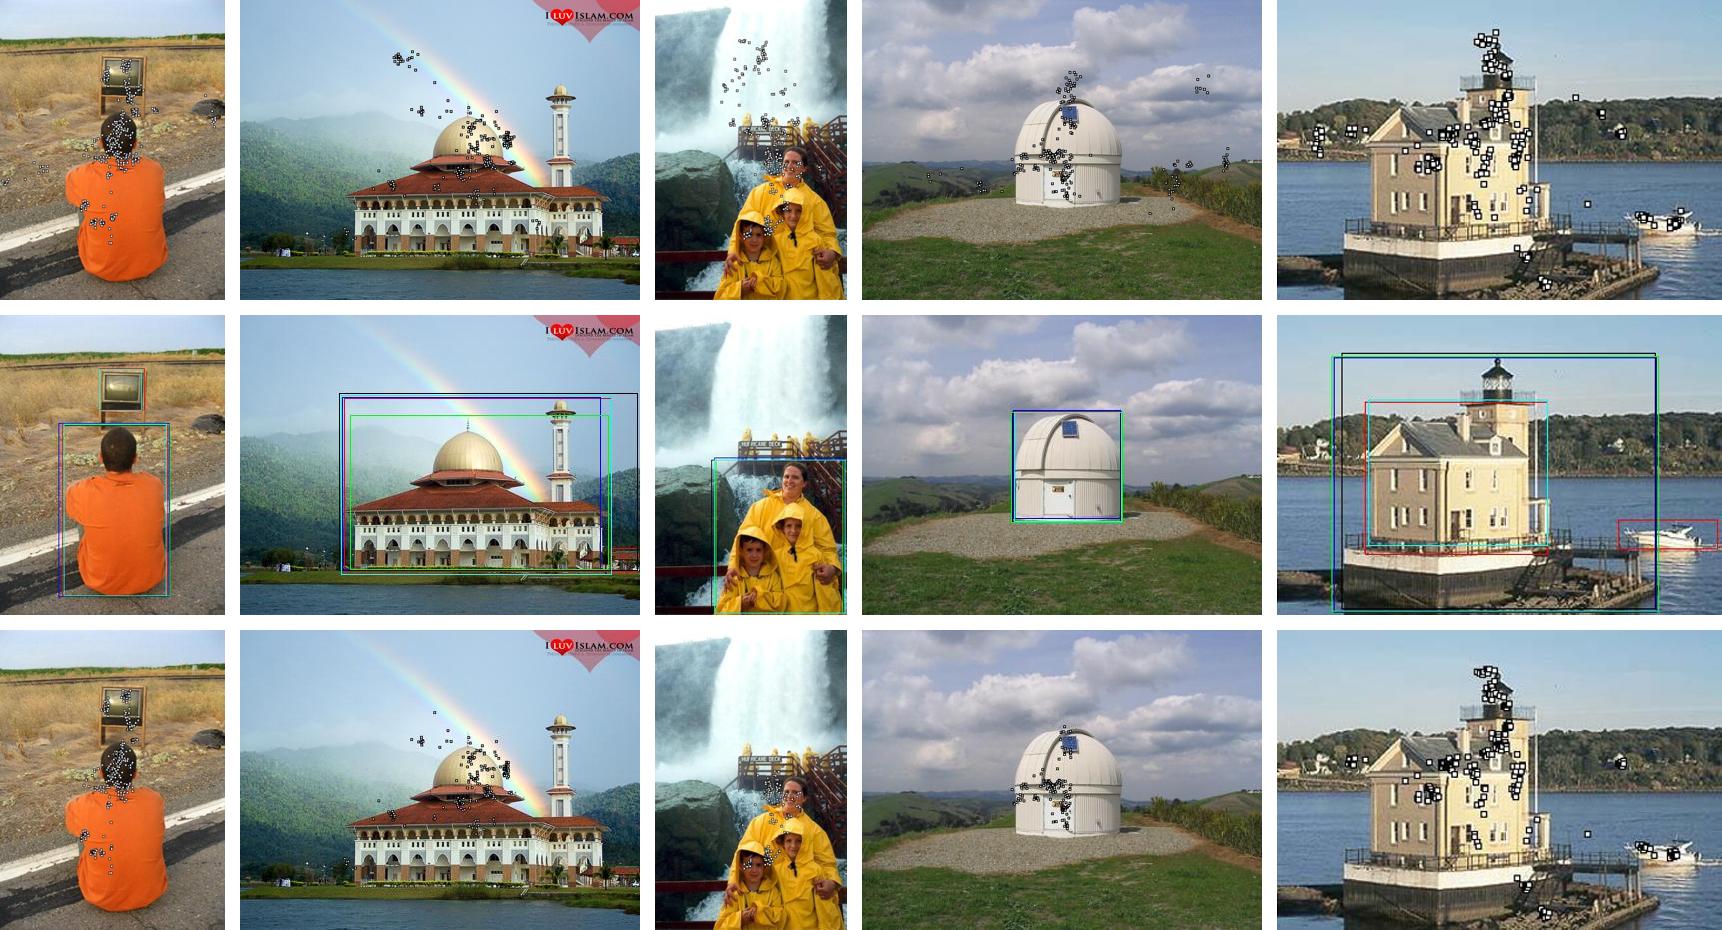
Figure 4: From top to bottom: original eye-fixations, bounding box ground truth and the eye-fixations after removing outliers.
Analysis of the eye fixation ground truth
We convolve a Gaussian filter across each fixation location and compute the sum of all the maps to generate a continuous saliency map after normalizing to \([0,1]\), as shown in Figure 5. We take similar method as 15 to threshold this map to get a binary map. A disadvantage is found in 15 (take the top \(n\) percent of the image as salient). When the salient region is smaller than \(n\%\) of the image, the corner will be identified as saliency, which is meaningless. Therefore we take the gray level as the threshold. Figure 5 shows some samples of the binary maps when the threshold \(n\) is set to \(0.1\).
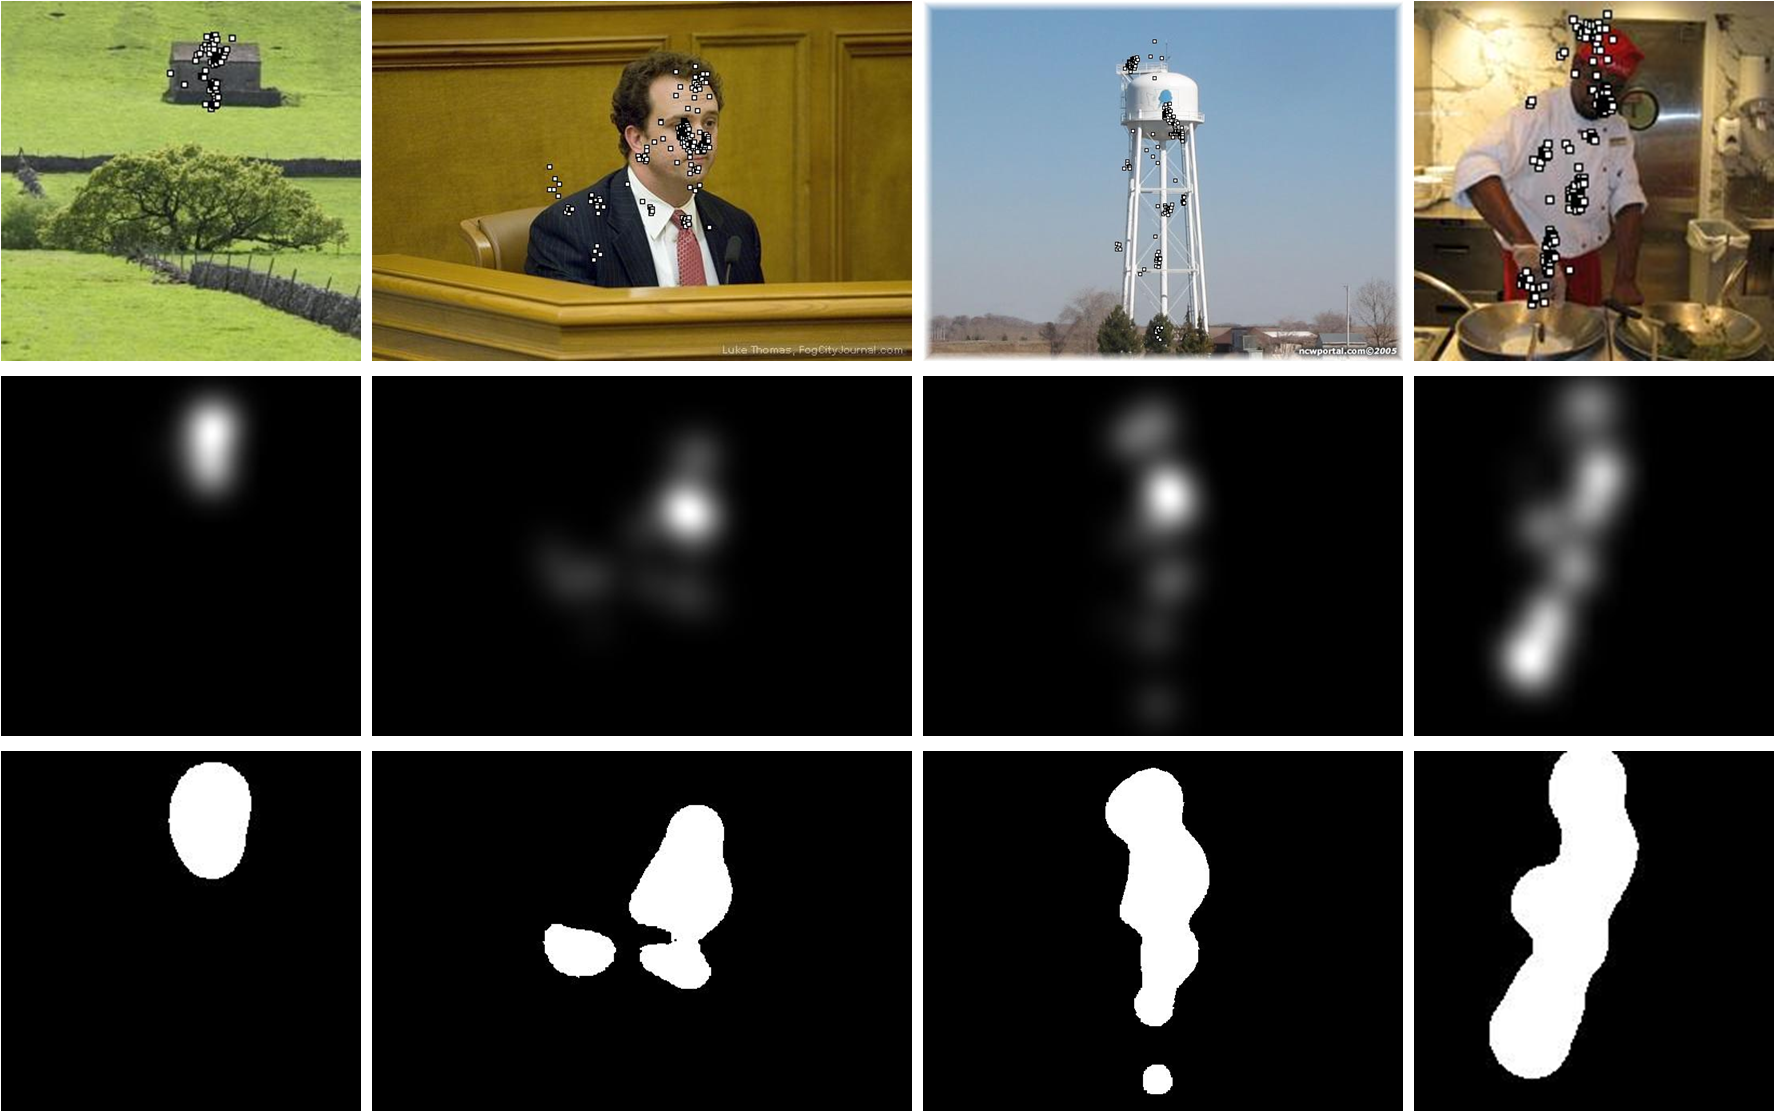
Figure 5: From top to bottom: input images with eye-fixations, continuous density map and the binary maps with threshold 0.1
We can see that this measure only formulate a rough fixation density map based on fixation locations, not accurate enough for quantitative performance evaluation. These density maps afford a representation for which similarity to saliency map may be considered at a glance by human eye in qualitative evaluation.
Center bias. We compute the sum of all the continuous saliency maps of all the \(5172\) images and normalize it within \([0,1]\). The average saliency map is shown in Figure 6. It demonstrates our dataset has a bias for human fixations to be near the center of the image.

Figure 6: The average saliency map
Consistency of the five participants. We utilize an ROC metric 15 to evaluate the consistency of the five subjects. The saliency maps from one subject’s fixation locations is treated as a binary classifier on every pixel in the image and fixation points from all the five subjects are used as ground truth. Figure 7 shows the ROC curves of the five subjects. The results demonstrate the eye fixation data have a high consistency among subjects.
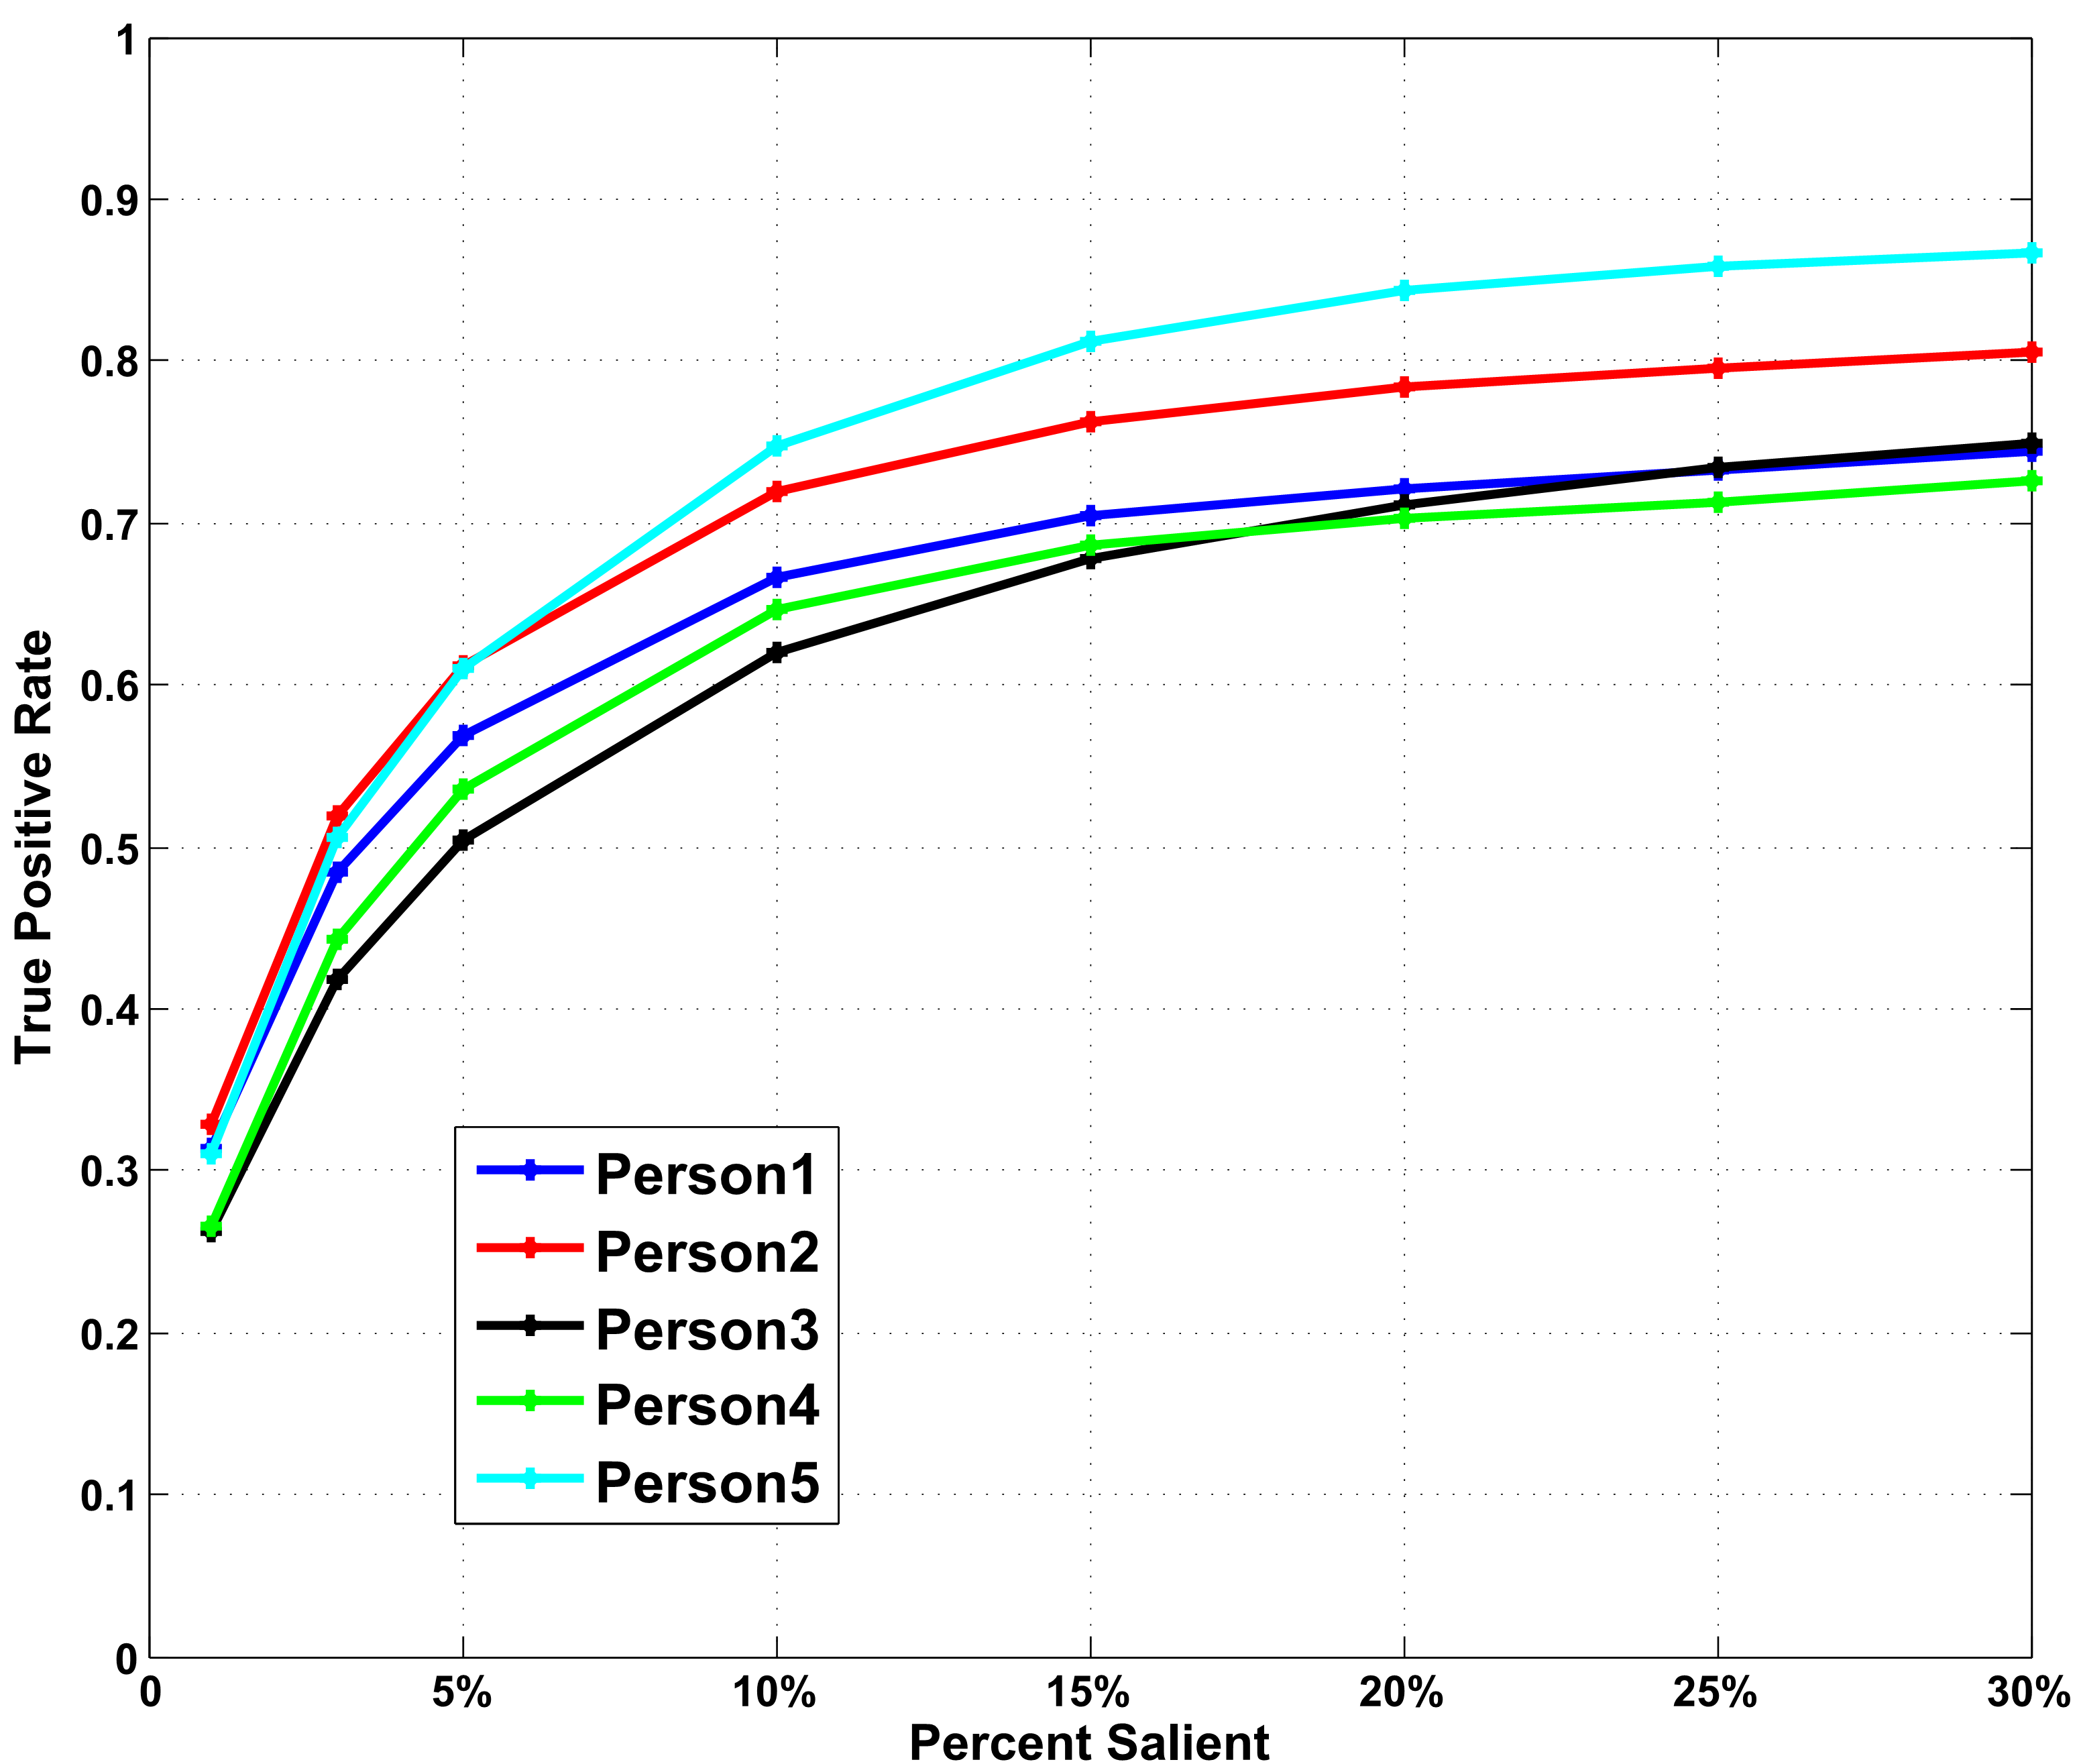
Figure 7: ROC curves for five persons.
Experimental results based on eye-fixation ground truth
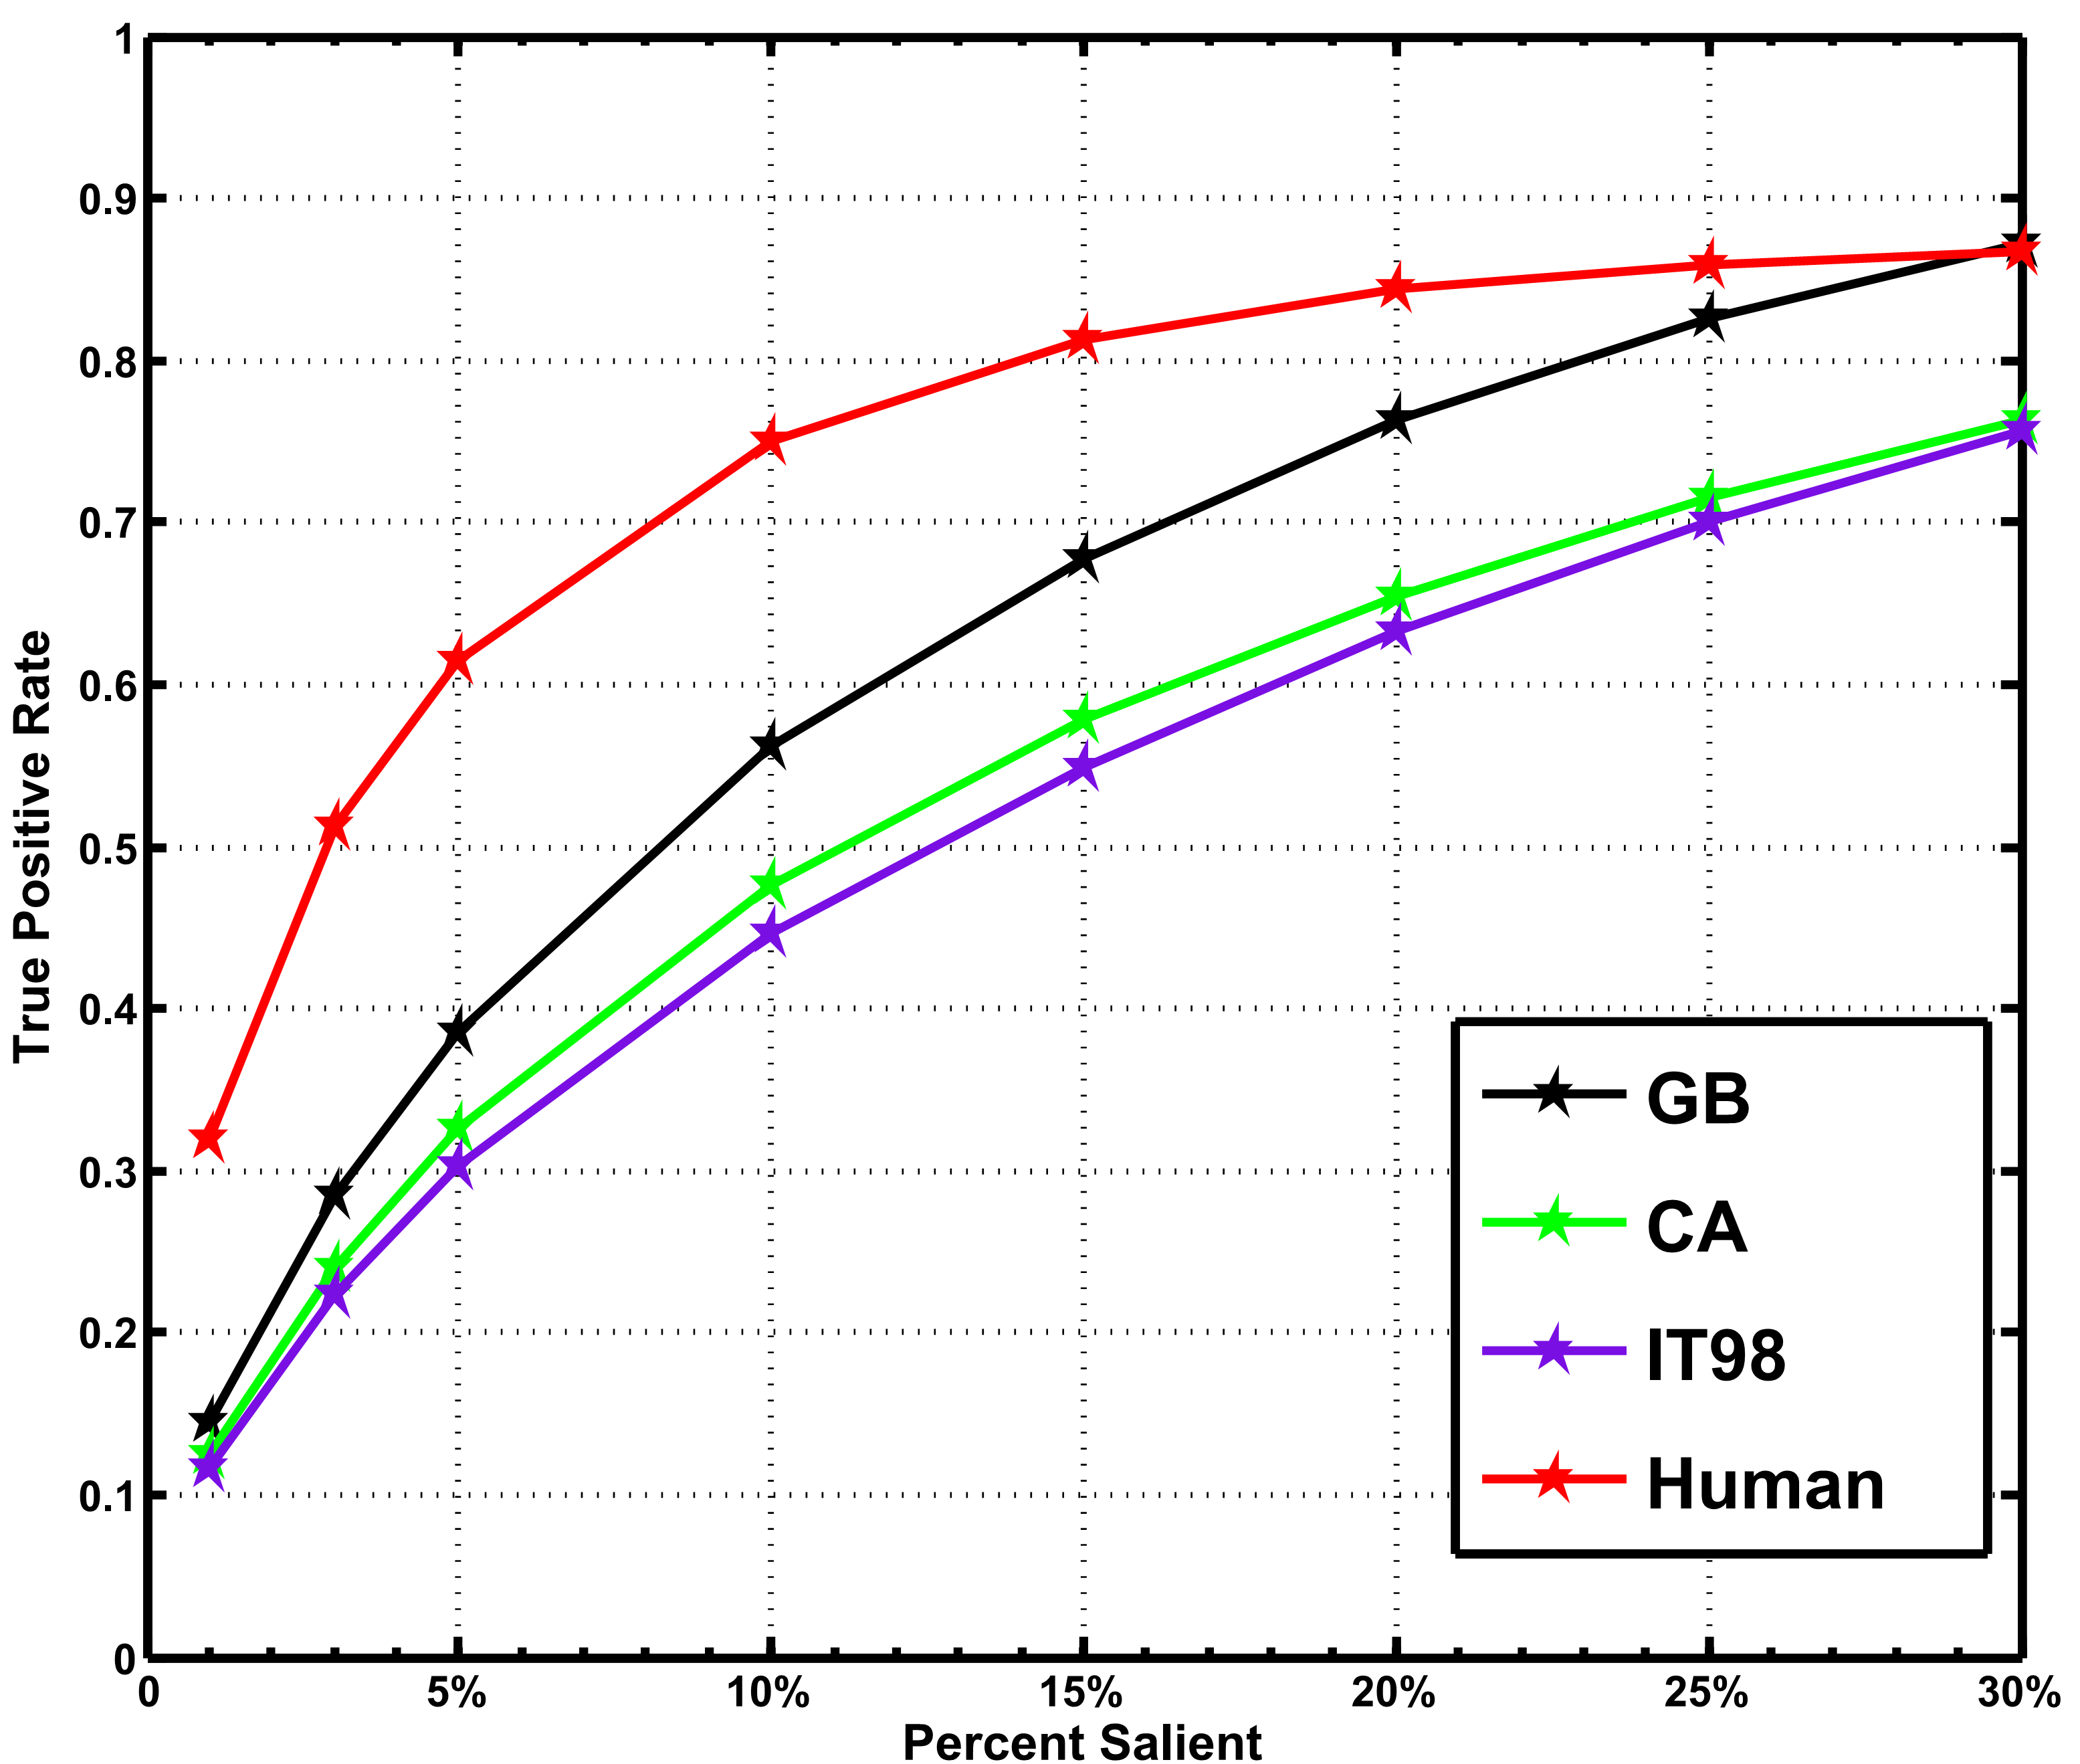
Figure 8: ROC [15] curves based on the DUT-OMRON dataset.
We introduce an ROC 15 method for the evaluation of eye-fixation prediction models. First, the saliency maps are thresholded at top \(n\) percent of the image for binary masks according to the gray level, where \(n=1,3,5,10,15,20,25,30\). Then for each binary mask, we compute the percentage of human fixations within salient area of the map as the performance (vertical coordinate) and the threshold is set as horizontal coordinate. By defining the threshold using other method (i.e. take the gray level as the threshold), we can also evaluate other models.
It's not fair to compare eye-fixation prediction models with saliency detection models. Thus we only evaluate three eye-fixation prediction algorithms, the GB 11, CA 10 and IT98 9 methods, using this evaluation criteria.
Figure 8 shows the evaluation results, where the human model is the Gauss-filtered saliency maps based on the eye-fixations of one participant in our experiment. The results indicate a big space for eye-fixation prediction models to improve.
Download
Please download dataset from below links
Please cite our paper if you use our dataset in your research
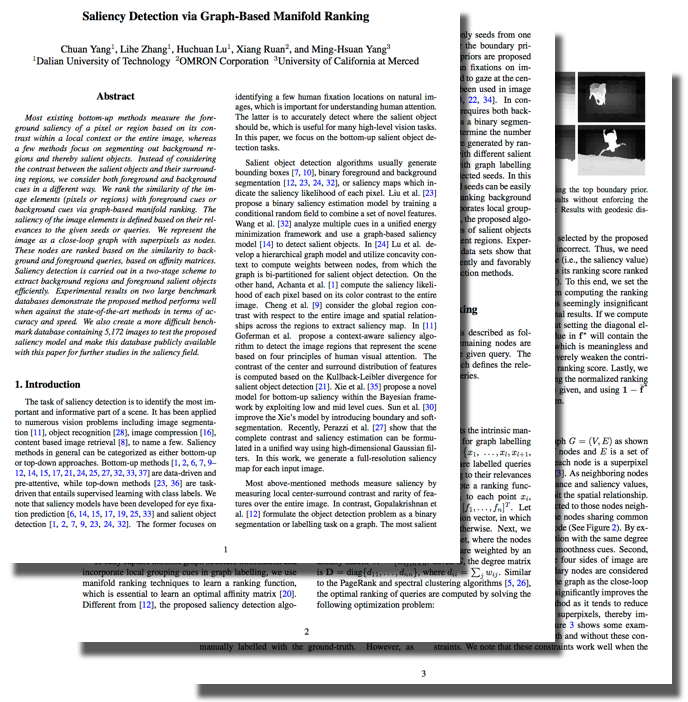 Chuan Yang, Lihe Zhang, Huchuan Lu, Xiang Ruan, Minghsuan Yang,
"Saliency Detection Via Graph-Based Manifold Ranking", CVPR2013, P3166-3173
Chuan Yang, Lihe Zhang, Huchuan Lu, Xiang Ruan, Minghsuan Yang,
"Saliency Detection Via Graph-Based Manifold Ranking", CVPR2013, P3166-3173
or by bibtex
@inproceedings{yang2013saliency,
title={Saliency detection via graph-based manifold ranking},
author={Yang, Chuan and Zhang, Lihe and Lu, Huchuan, Ruan, Xiang and Yang, Ming-Hsuan},
booktitle={Computer Vision and Pattern Recognition (CVPR), 2013 IEEE Conference on},
pages={3166--3173},
year={2013},
organization={IEEE}
}
You can download the source code of manifold ranking saliency from github for both
Detailed introduction of the dataset refer to our FCV14 paper
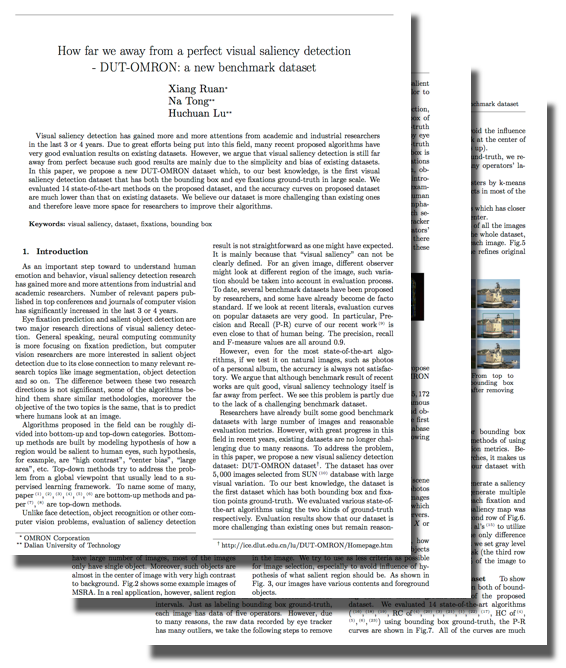 Xiang Ruan, Na Tong, Huchuan Lu
"How far we away from a perfect visual saliency detection - DUT-OMRON: a new benchmark dataset", FCV2014
Xiang Ruan, Na Tong, Huchuan Lu
"How far we away from a perfect visual saliency detection - DUT-OMRON: a new benchmark dataset", FCV2014
References
1, H. Jiang, J. Wang, Z. Yuan, T. Liu, N. Zheng, and S. Li, “Automatic salient object segmentation based on context and shape prior,” in Proceedings of British Machine Vision Conference, 2011.(bibtex)
2, Y. Xie, H. Lu, and M. Yang, “Bayesian saliency via low and mid level cues.” in IEEE Transaction On Image Processing, vol. 22, no. 5, 2013, pp. 1689–1698. (bibtex)
3, Y. Xie and H. Lu, “Visual saliency detection based on Bayesian model,” in Proceedings of IEEE International Conference on Image Processing, 2011, pp. 653–656. (bibtex)
4, M.-M. Cheng, G.-X. Zhang, N. J. Mitra, X. Huang, and S.-M. Hu, “Global contrast based salient region detection,” inProceedings of IEEE Conference on Computer Vision and Pattern Recognition, 2011, pp. 409–416. (bibtex)
5, E. Rahtu, J. Kannala, M. Salo, and J. Heikkil, “Segmenting salient objects from images and videos,” in Proceedings of European Conference on Computer Vision, 2010, pp. 366–379. (bibtex)
6, K. Chang, T. Liu, H. Chen, and S. Lai, “Fusing generic objectness and visual saliency for salient object detection,” in Proceedings of IEEE International Conference on Computer Vision, 2011, pp. 914–921. (bibtex)
7, X. Shen and Y. Wu, “A unified approach to salient object detection via low rank matrix recovery,” in Proceedings of IEEE Conference on Computer Vision and Pattern Recognition, 2012, pp. 853–860.(bibtex)
8, R. Achanta, S. S. Hemami, F. J. Estrada, and S. Süsstrunk, “Frequency-tuned salient region detection,” in Proceedings of IEEE Conference on Computer Vision and Pattern Recognition, 2009, pp. 1597–1604.(bibtex)
9, L. Itti, C. Koch, and E. Niebur, “A model of saliency-based visual attention for rapid scene analysis,” IEEE Transactions on Pattern Analysis and Machine Intelligence, vol. 20, pp. 1254–1259, 1998. (bibtex)
10, S. Goferman, L. Zelnik-Manor, and A. Tal, “Context-aware saliency detection,” in Proceedings of IEEE Conference on Computer Vision and Pattern Recognition, 2010, pp. 2376–2383. (bibtex)
11, J. Harel, C. Koch, and P. Perona, “Graph-based visual saliency,” in Advances in Neural Processing Systems, 2006, pp. 545–552. (bibtex)
12, X. Hou and L. Zhang, “Saliency detection: a spectral residual approach,” in Proceedings of IEEE Conference on Computer Vision and Pattern Recognition, 2007. (bibtex)
13, Y. Zhai and M. Shah, “Visual attention detection in video sequences using spatiotemporal cues,” in Proceedings of ACM International Conference on Multimedia and Expo, 2006, pp. 815–824. (bibtex)
14, T. Liu, J. Sun, N.-N. Zheng, X. Tang, and H.-Y. Shum, “Learning to detect a salient object,” in Proceedings of IEEE Conference on Computer Vision and Pattern Recognition, 2007. (bibtex)
15, T. Judd, K. Ehinger, F. Durand, and A. Torralba, “Learning to predict where humans look,” in12th international conference on Computer Vision, 2009, pp. 2106–2113. (bibtex)
16, S. Ramanathan, H. Katti, N. Sebe, M. Kankanhalli, and T.-S. Chua, “An eye fixation database for saliency detection in images,” Proceedings of European Conference on Computer Vision, pp. 30–43, 2010. (bibtex)
17, B. Jiang, L. Zhang, H. Lu, C. Yang, and M.-H. Yang, “Saliency detection via absorbing markov chain,” in Proceedings of IEEE International Conference on Computer Vision, 2013. (bibtex)
18, X. Li, H. Lu, L. Zhang, X. Ruan, and M.-H. Yang, “Saliency detection via dense and sparse reconstruction,” in Proceedings of IEEE International Conference on Computer Vision, 2013. (bibtex)
19, C. Yang, L. Zhang, H. Lu, X. Ruan, and M.-H. Yang, “Saliency detection via graph-based manifold ranking.” CVPR2013. (bibtex)